How to Graph a Linear Equation (y = mx + b)
How to Graph a Linear Equation
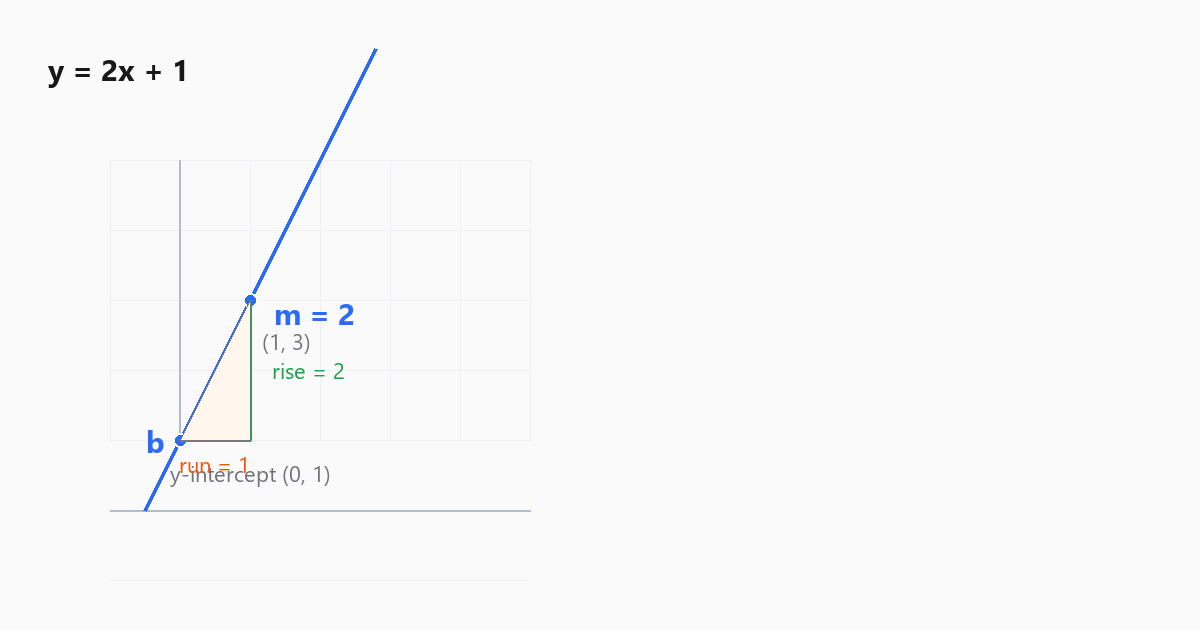
Graph a linear equation in slope-intercept form by plotting the y-intercept on the y-axis, then using the slope as rise over run to step to a second point, and drawing a straight line through both points. A linear equation written as y = mx + b graphs as a straight line, where m sets the slope and b sets the y-intercept. For y = 2x + 1, plot the point (0, 1), rise 2 and run 1 to reach (1, 3), and connect the two points.
A linear equation has one defining property: its graph is always a straight line, because the variable x carries an exponent of 1. Two correct points fix that line completely. The Graphing Calculator plots any linear equation the moment it is typed, and the method below shows how the line is built point by point.
The Slope-Intercept Form
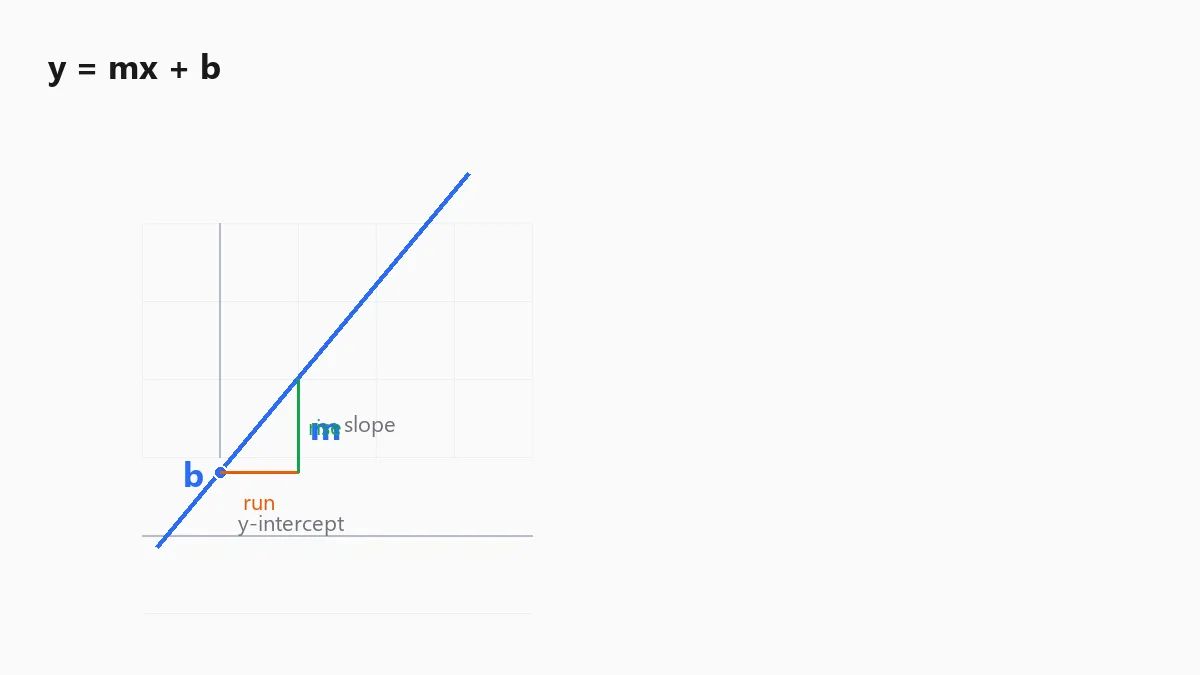
The slope-intercept form of a linear equation is y = mx + b, where m is the slope and b is the y-intercept. The slope m measures how steeply the line rises or falls, and the y-intercept b marks where the line crosses the y-axis. These two numbers describe the entire line.
Read the two values straight from the equation. In y = 2x + 1, the slope is 2 and the y-intercept is 1. In y = -0.5x + 3, the slope is -0.5 and the y-intercept is 3. A positive slope produces a line that rises from left to right, and a negative slope produces a line that falls from left to right.
How to Graph a Linear Equation Step by Step
Graph a linear equation in slope-intercept form in 4 steps:
- Plot the y-intercept b as a point on the y-axis, at coordinates (0, b).
- Write the slope m as a fraction, rise over run, so a slope of 2 becomes 2/1.
- From the y-intercept, move up by the rise and right by the run to mark a second point.
- Draw a straight line through both points and extend it across the coordinate plane.
For a negative slope, move down by the rise instead of up. A slope of -3/4 means down 3 and right 4. Two points are enough to draw the line, but a third point, found by repeating the rise-over-run step, confirms the line is straight.
Worked Example: Graph y = 2x + 1
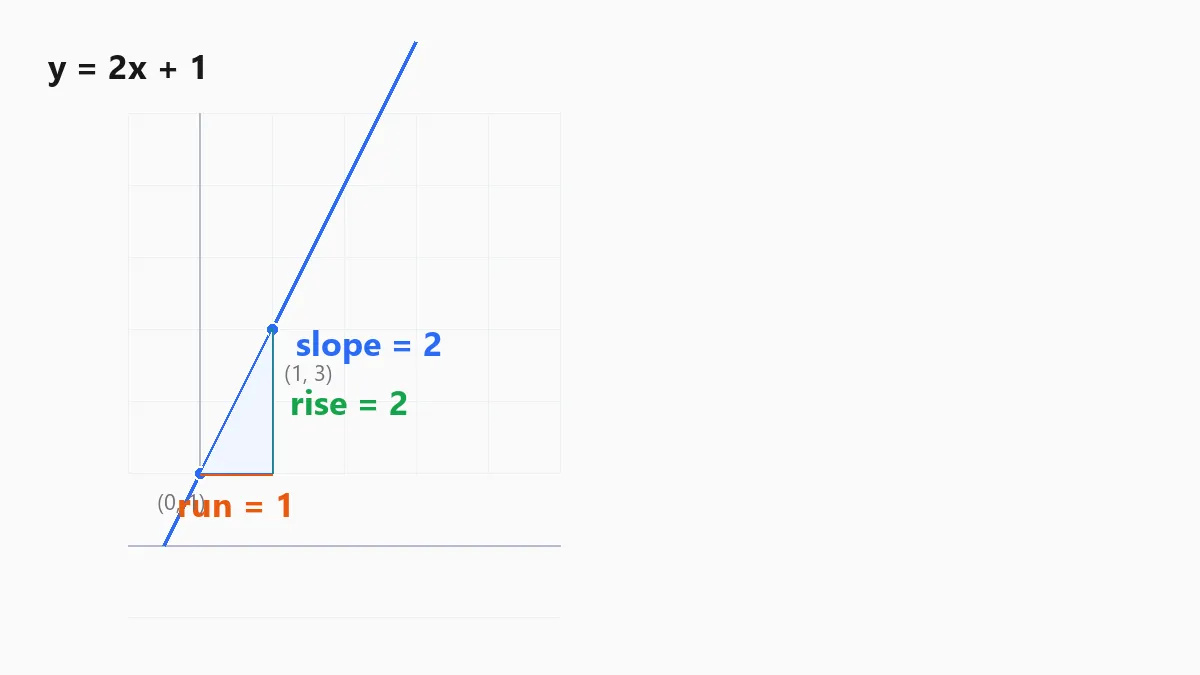
Graph the linear equation y = 2x + 1 using the slope and intercept.
- The y-intercept is 1, so plot the point (0, 1) on the y-axis.
- The slope is 2, written as 2/1, so the rise is 2 and the run is 1.
- From (0, 1), move up 2 and right 1 to reach the point (1, 3).
- Draw a straight line through (0, 1) and (1, 3).
The line passes through (0, 1) and (1, 3) and continues in both directions. Checking a third point confirms the graph: at x = 2, y = 2(2) + 1 = 5, and the point (2, 5) lies on the same line. The graphing calculator plots this line and marks each point when the equation is entered.
How to Graph a Linear Equation From Two Points
A linear equation can be graphed from any two points that satisfy it. Choose two x-values, calculate the matching y-values, plot the points, and draw the line. For y = 2x + 1, x = 0 gives y = 1 and x = 3 gives y = 7, so the line passes through (0, 1) and (3, 7).
This method works when the slope is awkward to step out by hand, such as a slope of 7 or a fraction with a large denominator. Two points determine a line, so any two correct pairs produce the same graph. Spacing the two x-values apart makes the line easier to draw accurately.
How to Graph a Linear Equation From Standard Form
Standard form writes a linear equation as Ax + By = C. Convert it to slope-intercept form by solving for y, then graph with the slope and intercept. For 2x + y = 1, subtract 2x from both sides to get y = -2x + 1, which has a slope of -2 and a y-intercept of 1.
The intercept method graphs standard form without converting. Set x to 0 and solve for y to find the y-intercept, then set y to 0 and solve for x to find the x-intercept. For 2x + 3y = 6, the y-intercept is (0, 2) and the x-intercept is (3, 0), and the line runs through both. Solving linear systems built from several such equations is the point where a matrix calculator takes over from a single graph.
Special Cases: Horizontal and Vertical Lines
Two linear equations graph as special lines. An equation of the form y = b, such as y = 3, graphs as a horizontal line crossing the y-axis at 3, because the slope is 0 and y never changes. An equation of the form x = a, such as x = -2, graphs as a vertical line crossing the x-axis at -2.
A vertical line is the one linear graph that slope-intercept form cannot express, because its slope is undefined. Recognizing these two forms prevents the common error of trying to force x = a into y = mx + b.
Common Mistakes When Graphing a Linear Equation
Three common mistakes appear when graphing a linear equation:
- Reversing rise and run, moving right by the rise and up by the run, which flips the slope.
- Plotting the y-intercept on the x-axis instead of the y-axis.
- Dropping a negative sign on the slope, which sends the line the wrong direction.
Two further errors distort the graph. Reading the slope as only the numerator, and forgetting the run is 1, misplaces the second point for whole-number slopes. Drawing the line through a single point without a second reference produces the wrong angle. Enter the equation into the Graphing Calculator to check the slope, intercept, and direction of any line.
Frequently Asked Questions
How do you graph a linear equation in slope-intercept form?
Plot the y-intercept b on the y-axis, then use the slope m as rise over run to step to a second point. Draw a straight line through both points. For y = 2x + 1, plot (0, 1), rise 2 and run 1 to reach (1, 3), then connect them.
What is the slope in y = mx + b?
The slope m is the rate at which the line rises or falls, written as rise over run. A slope of 2 means the line rises 2 units for every 1 unit right. A positive slope rises left to right, and a negative slope falls left to right.
How do you find the y-intercept of a linear equation?
The y-intercept is the value of y when x equals 0, and in y = mx + b it is the constant b. On the graph it is the point where the line crosses the y-axis. For y = 2x + 1, the y-intercept is 1, at the point (0, 1).
How do you graph a linear equation from standard form?
Convert standard form Ax + By = C to slope-intercept form by solving for y, then graph with the slope and intercept. You can also find the two axis intercepts directly: set x to 0 for the y-intercept and y to 0 for the x-intercept, then draw the line through both points.
How do you graph a linear equation using two points?
Choose two x-values, calculate the matching y-values from the equation, plot both points, and draw a straight line through them. Two points determine a line, so any two correct points give the full graph of a linear equation.
Ready to run the numbers? Use the Graphing Calculator.